🅿️ Plot Gaze#
plot_gaze is a fuction which plots gaze distribution during trials using samples files. It is useful to understand how the gaze is distributed during the trials.
Warning
despite the ETdata viwer which removes exponential gaze data, this code keeps all gaze recorded from the moment TRIALID message is passed until the moment TRIAL_RESULT message is passed.
This is the reason you may see two extra lines in the plot.
as it can be seen, you need to pass few important elements:
samplesfile This is the file where you obtain from export filetrialnumber: easily pass the number of trial for example 45 or elsescreen_widthandscreen_height: These are the screen width and height of the screen where the experiment was conducted. This is important to scale the gaze points.
import etformat as et
import pandas as pd
samples = pd.read_csv(r"D:\Github_web_page_website\test_samples.csv")
et.plot_gaze(samples, 45, screen_width=2560, screen_height=1440)
📖 etformat 1.1.1 - For Documentation, visit: https://ahsankhodami.github.io/etformat/intro.html
⚠️ Default screen size is 2560x1440. If incorrect, specify `screen_width` and `screen_height`.
✅ Trial 45 has 3246 gaze points.
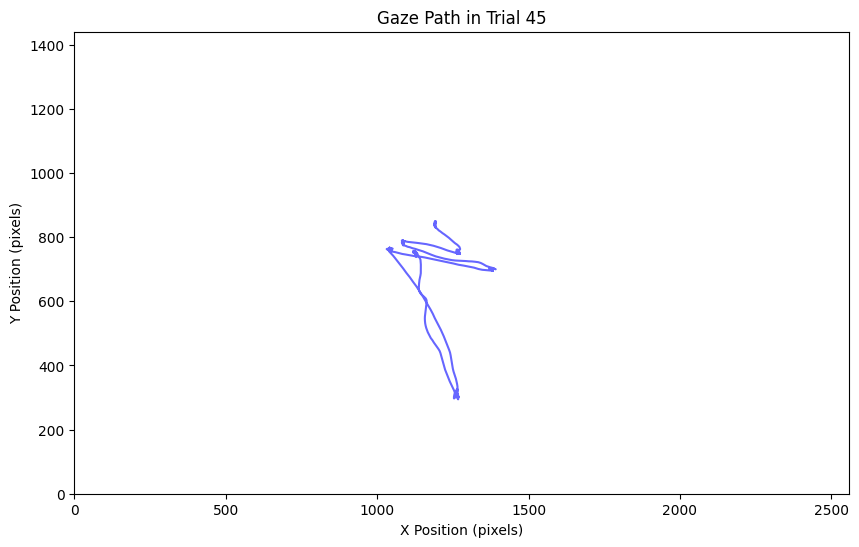
function also provides detail of number of gaze recorded during the trial.