Chapter 3.1: Introduction to Fractions#
Mathematics for Psychologists and Computation
Welcome to Chapter 3.1! In this chapter, we’ll explore fractions - one of the most fundamental concepts in mathematics, and one that appears throughout psychological research and statistics.
import warnings
warnings.filterwarnings("ignore")
import matplotlib.pyplot as plt
plt.rcParams['axes.grid'] = False  # Ensure grid is turned off
plt.rcParams['figure.dpi'] = 300
What Are Fractions?#
A fraction represents a part of a whole. It consists of two numbers:
The numerator (top number): tells us how many parts we have
The denominator (bottom number): tells us how many equal parts make up the whole
We write fractions as: \(\frac{\text{numerator}}{\text{denominator}}\)
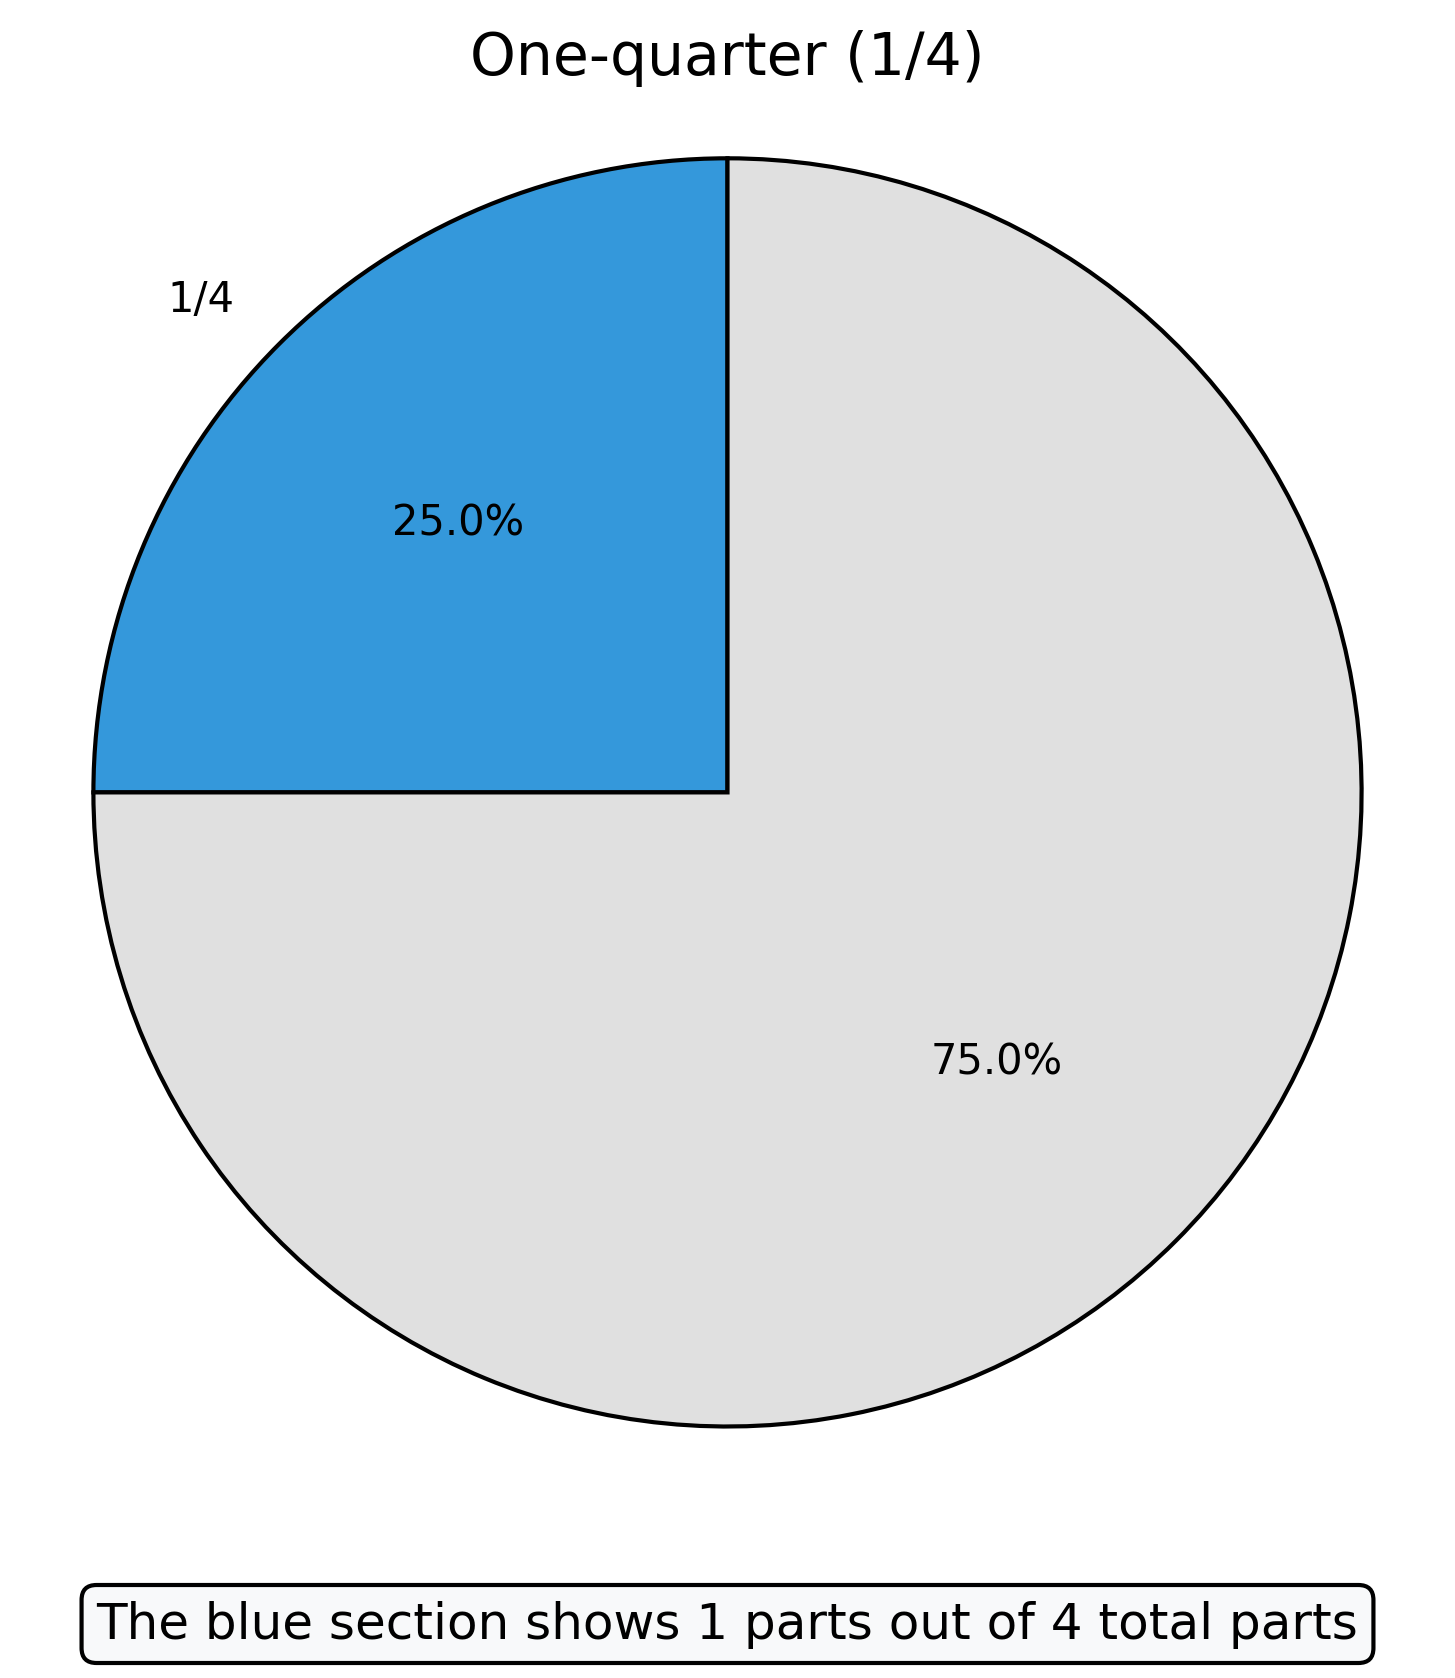
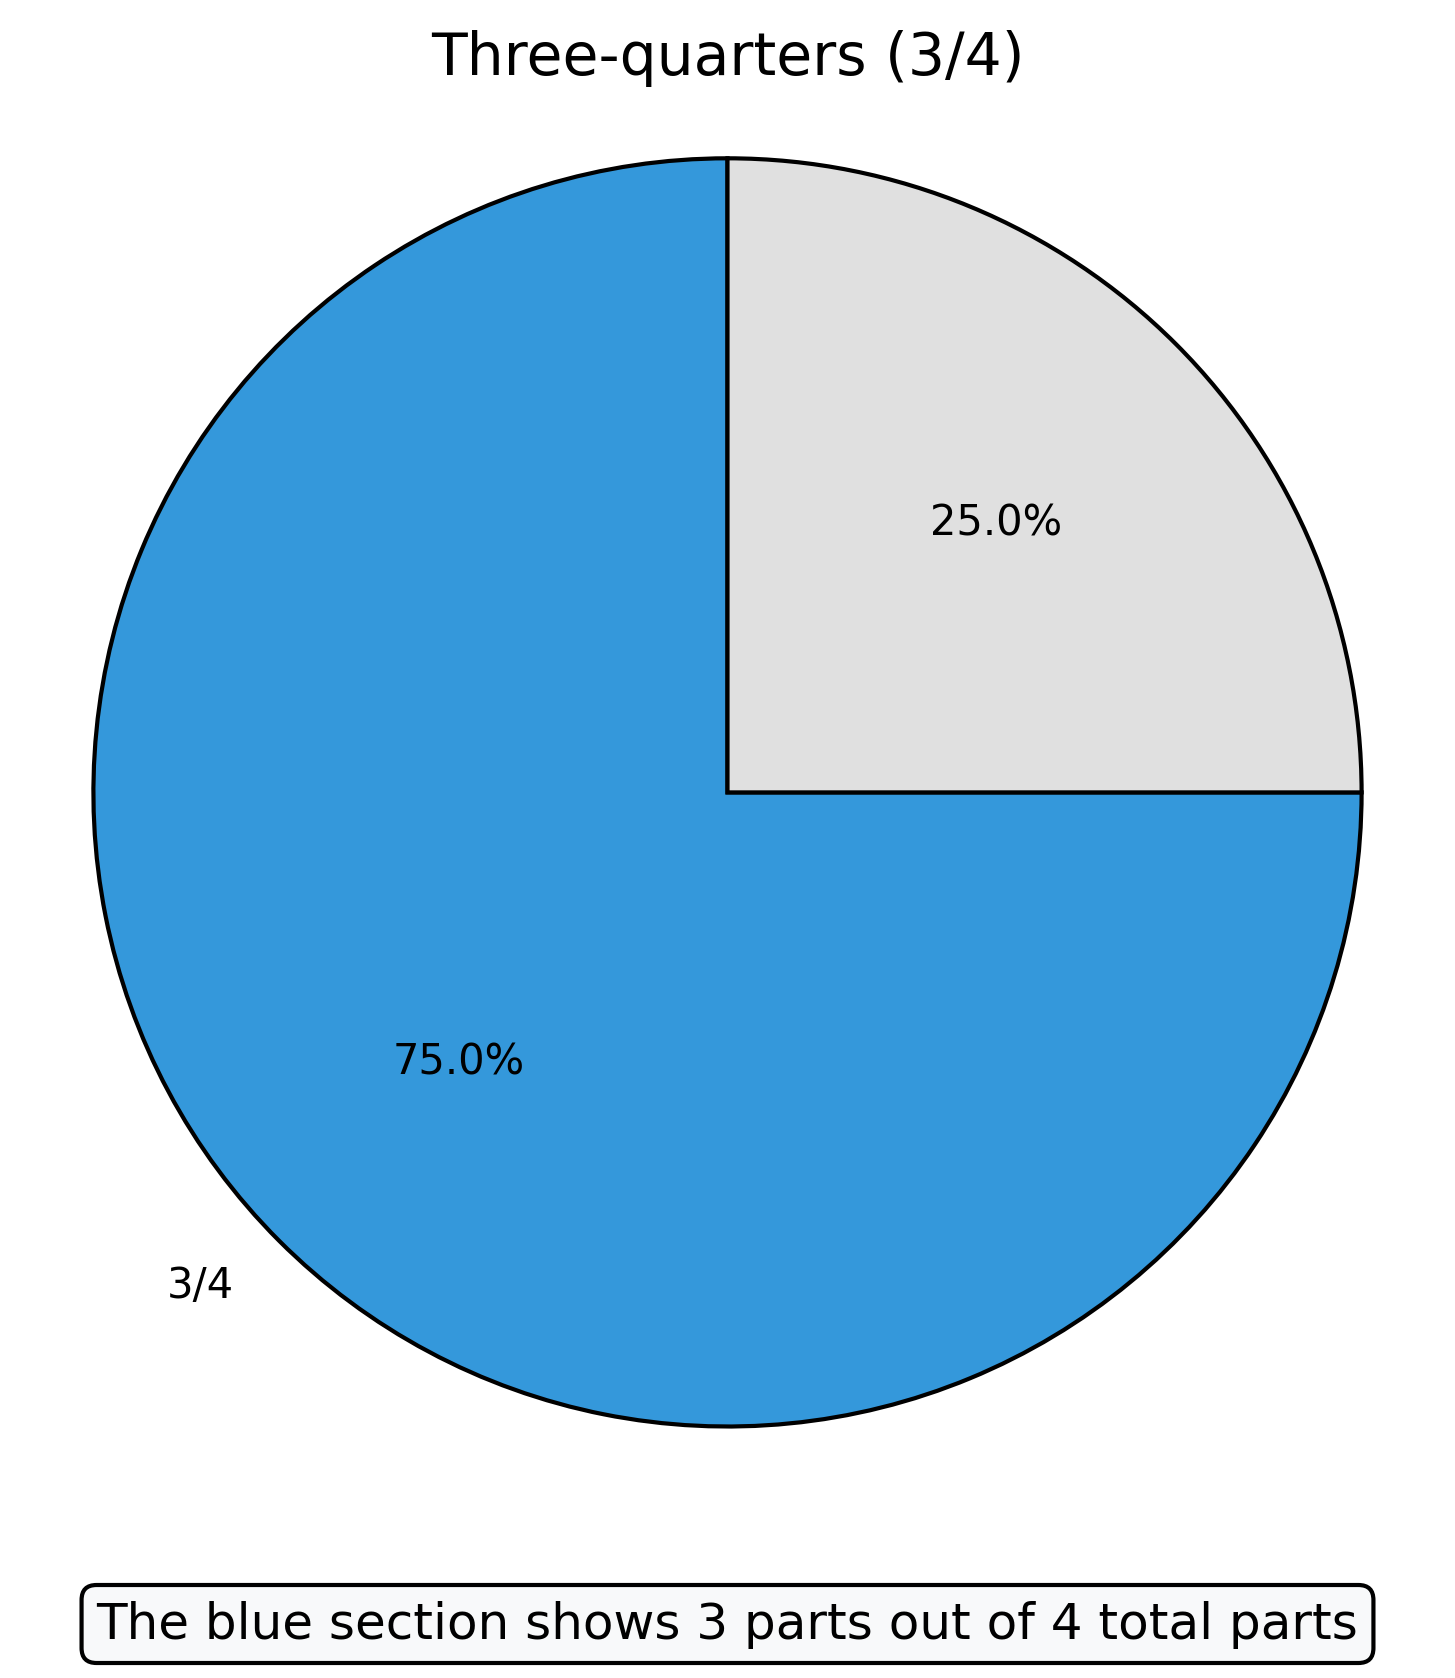
For example, \(\frac{3}{4}\) means “three out of four equal parts” or “three-quarters.”
Visualizing Fractions#
Let’s use Python to help us visualize some basic fractions. Seeing fractions graphically can make them more intuitive.
import matplotlib.pyplot as plt
import numpy as np

# Function to visualize a fraction as a pie chart
def visualize_fraction_pie(numerator, denominator, title=None):
    # Create the data for the pie chart
    data = [numerator, denominator - numerator]
    labels = [f'{numerator}/{denominator}', '']
    colors = ['#3498db', '#e0e0e0']

    # Create the pie chart
    plt.figure(figsize=(6, 6))
    plt.pie(data, labels=labels, colors=colors,
            autopct=lambda p: f'{p:.1f}%' if p > 5 else '',
            startangle=90, wedgeprops={'edgecolor': 'black'})
    plt.axis('equal')  # Equal aspect ratio ensures that pie is drawn as a circle

    if title:
        plt.title(title, fontsize=14)
    else:
        plt.title(f'Visualizing the fraction {numerator}/{denominator}', fontsize=14)

    # Add an annotation explaining what the visualization shows
    plt.annotate(f'The blue section shows {numerator} parts out of {denominator} total parts',
                xy=(0.5, -0.1), xycoords='axes fraction',
                ha='center', va='center', fontsize=12,
                bbox=dict(boxstyle="round,pad=0.3", fc="#f8f9fa", ec="black", lw=1))

    plt.show()

# Visualize some example fractions
visualize_fraction_pie(1, 4, title="One-quarter (1/4)")
# Visualize another fraction
visualize_fraction_pie(3, 4, title="Three-quarters (3/4)")
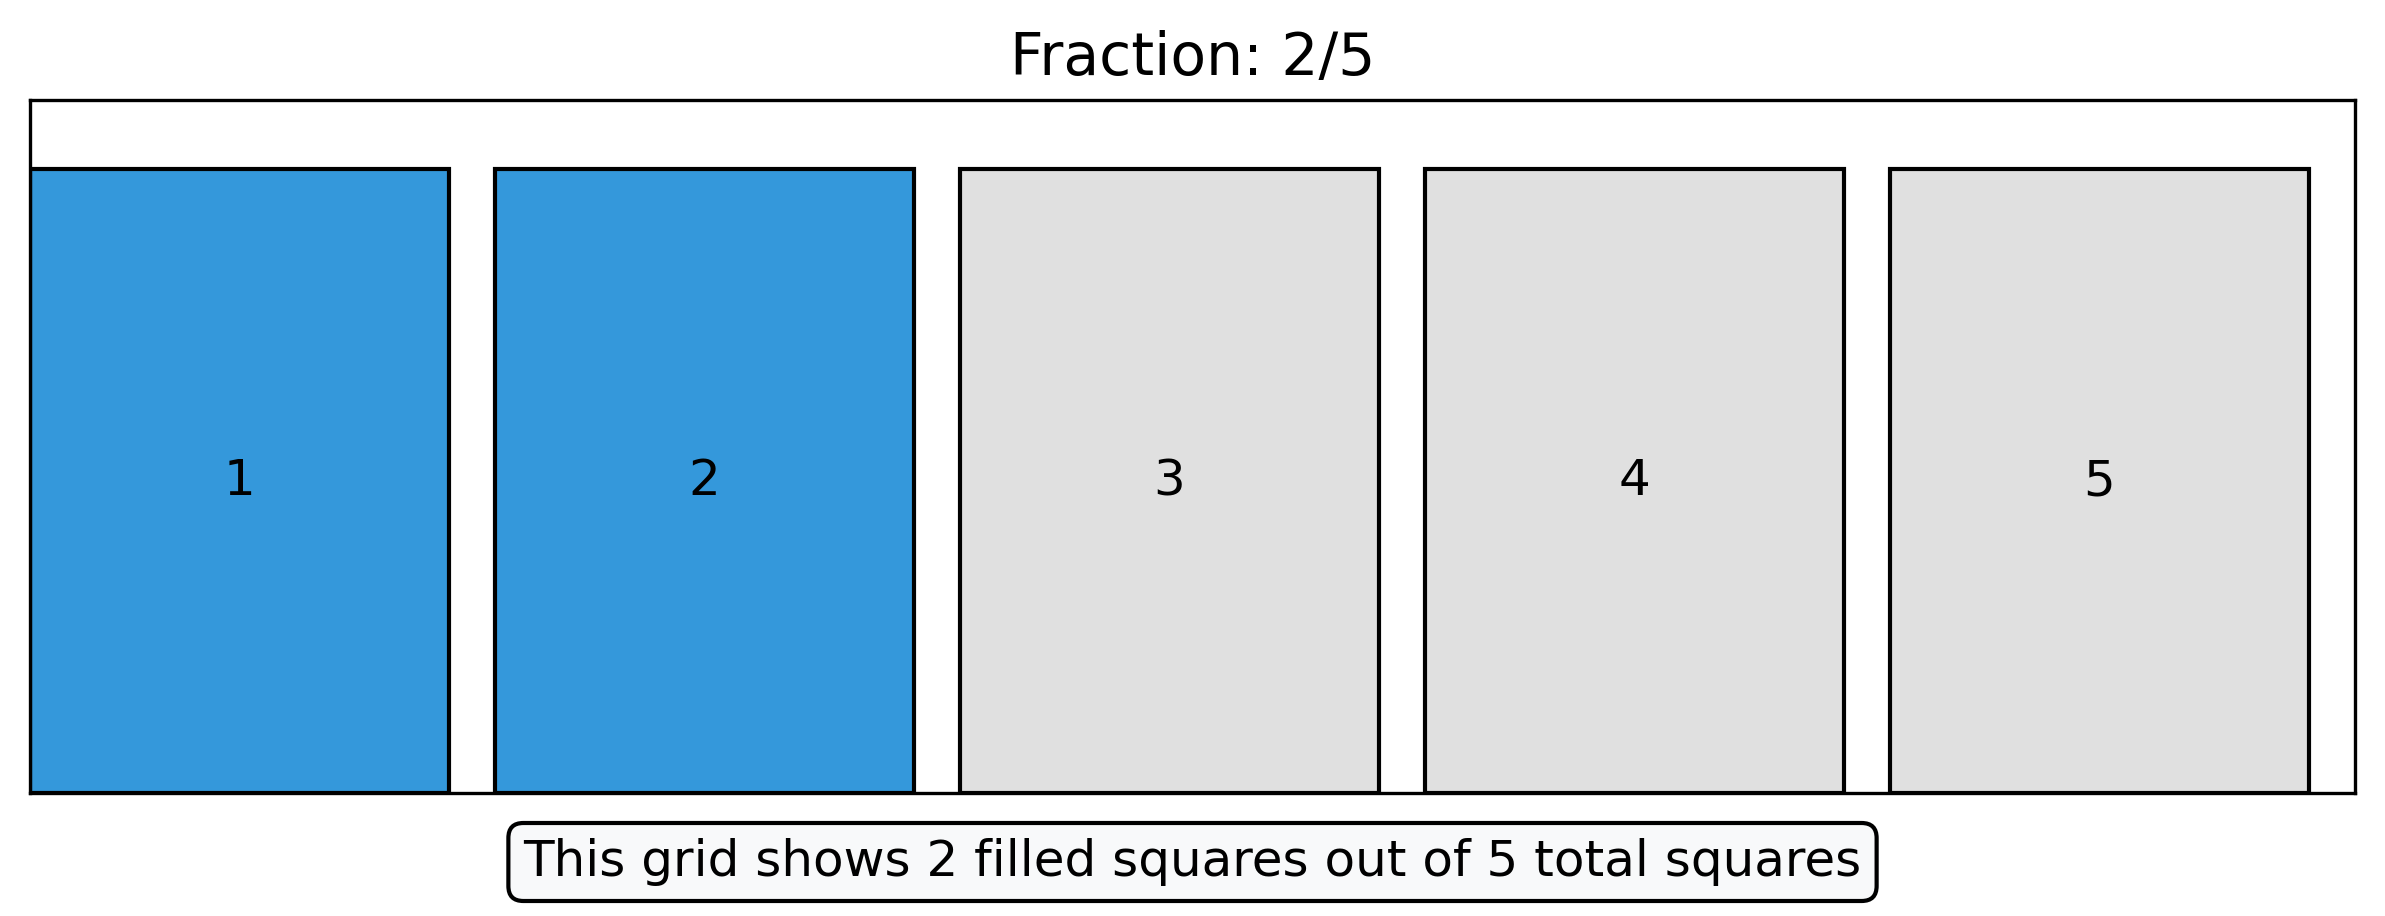
Let’s also visualize fractions using rectangles, which are often used in psychological research to represent data:
# Function to visualize a fraction as a rectangular grid
def visualize_fraction_grid(numerator, denominator, rows=1):
# Calculate number of columns needed
cols = denominator // rows
if denominator % rows != 0:
cols += 1
# Create a figure and axis
fig, ax = plt.subplots(figsize=(10, 3))
# Remove axes
ax.set_xticks([])
ax.set_yticks([])
# Set title
ax.set_title(f'Fraction: {numerator}/{denominator}', fontsize=14)
# Create a grid of cells
count = 0
for i in range(rows):
for j in range(cols):
count += 1
if count > denominator:
break
# Determine if this cell should be colored (part of numerator)
if count <= numerator:
color = '#3498db' # Blue for the numerator parts
else:
color = '#e0e0e0' # Light gray for the remaining parts
# Add the rectangle
rect = plt.Rectangle((j, rows-i-1), 0.9, 0.9, color=color, ec='black')
ax.add_patch(rect)
# Add text in the center of the rectangle
ax.text(j + 0.45, rows-i-1 + 0.45, str(count),
ha='center', va='center', fontsize=12)
# Set the limits
ax.set_xlim(0, cols)
ax.set_ylim(0, rows)
# Add an annotation explaining what the visualization shows
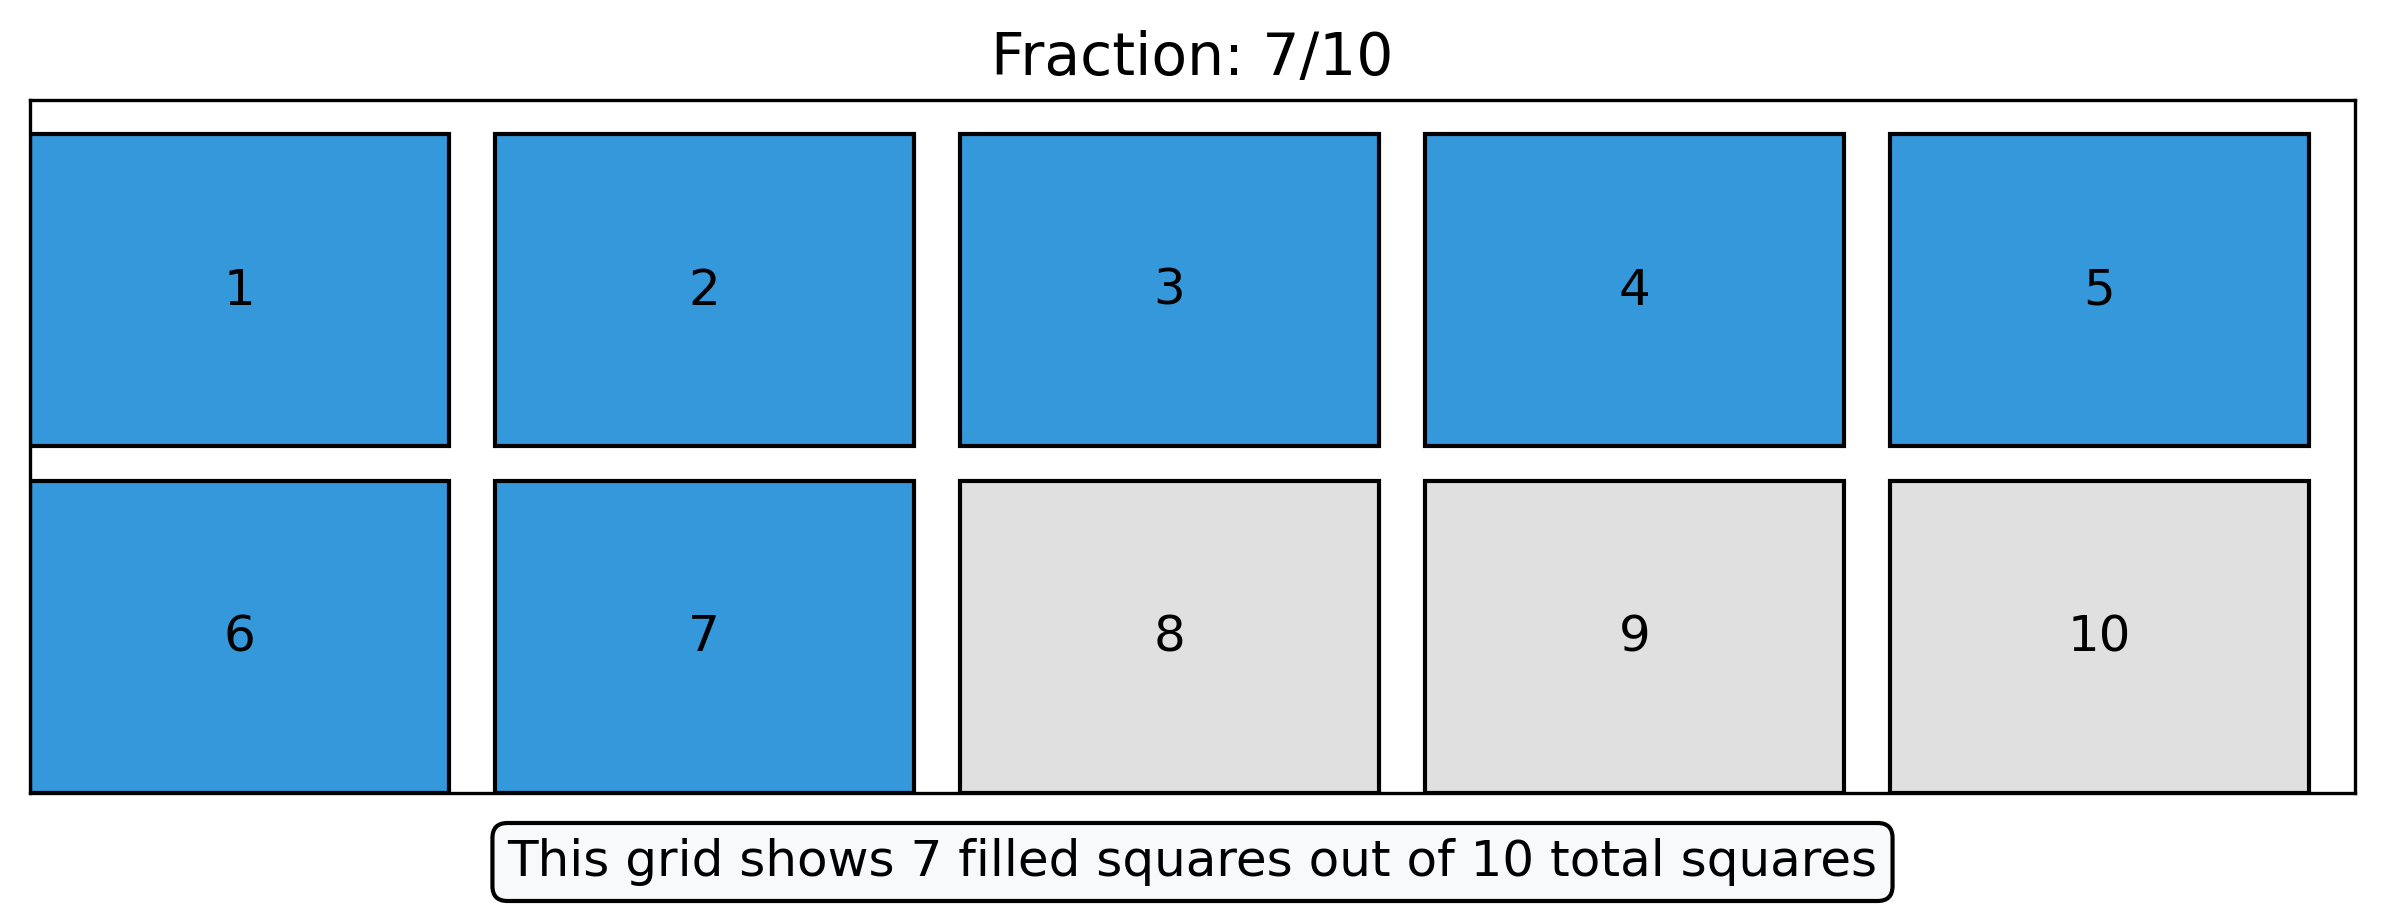
plt.annotate(f'This grid shows {numerator} filled squares out of {denominator} total squares',
xy=(0.5, -0.1), xycoords='axes fraction',
ha='center', va='center', fontsize=12,
bbox=dict(boxstyle="round,pad=0.3", fc="#f8f9fa", ec="black", lw=1))
plt.show()
# Example: Visualize 2/5 as a grid
visualize_fraction_grid(2, 5)
# Example: Visualize 7/10 as a grid
visualize_fraction_grid(7, 10, rows=2)  # Arranged in 2 rows for better visualization
Fractions in Psychology Research#
Fractions show up in many areas of psychological research:
Proportions of participants: “3/4 of participants completed the study”
Response rates: “Participants responded correctly to 7/10 trials”
Test scores: “The average score was 42/50 points”
Time intervals: “Each stimulus was presented for 1/2 second”
Let’s look at a simple example from psychology research:
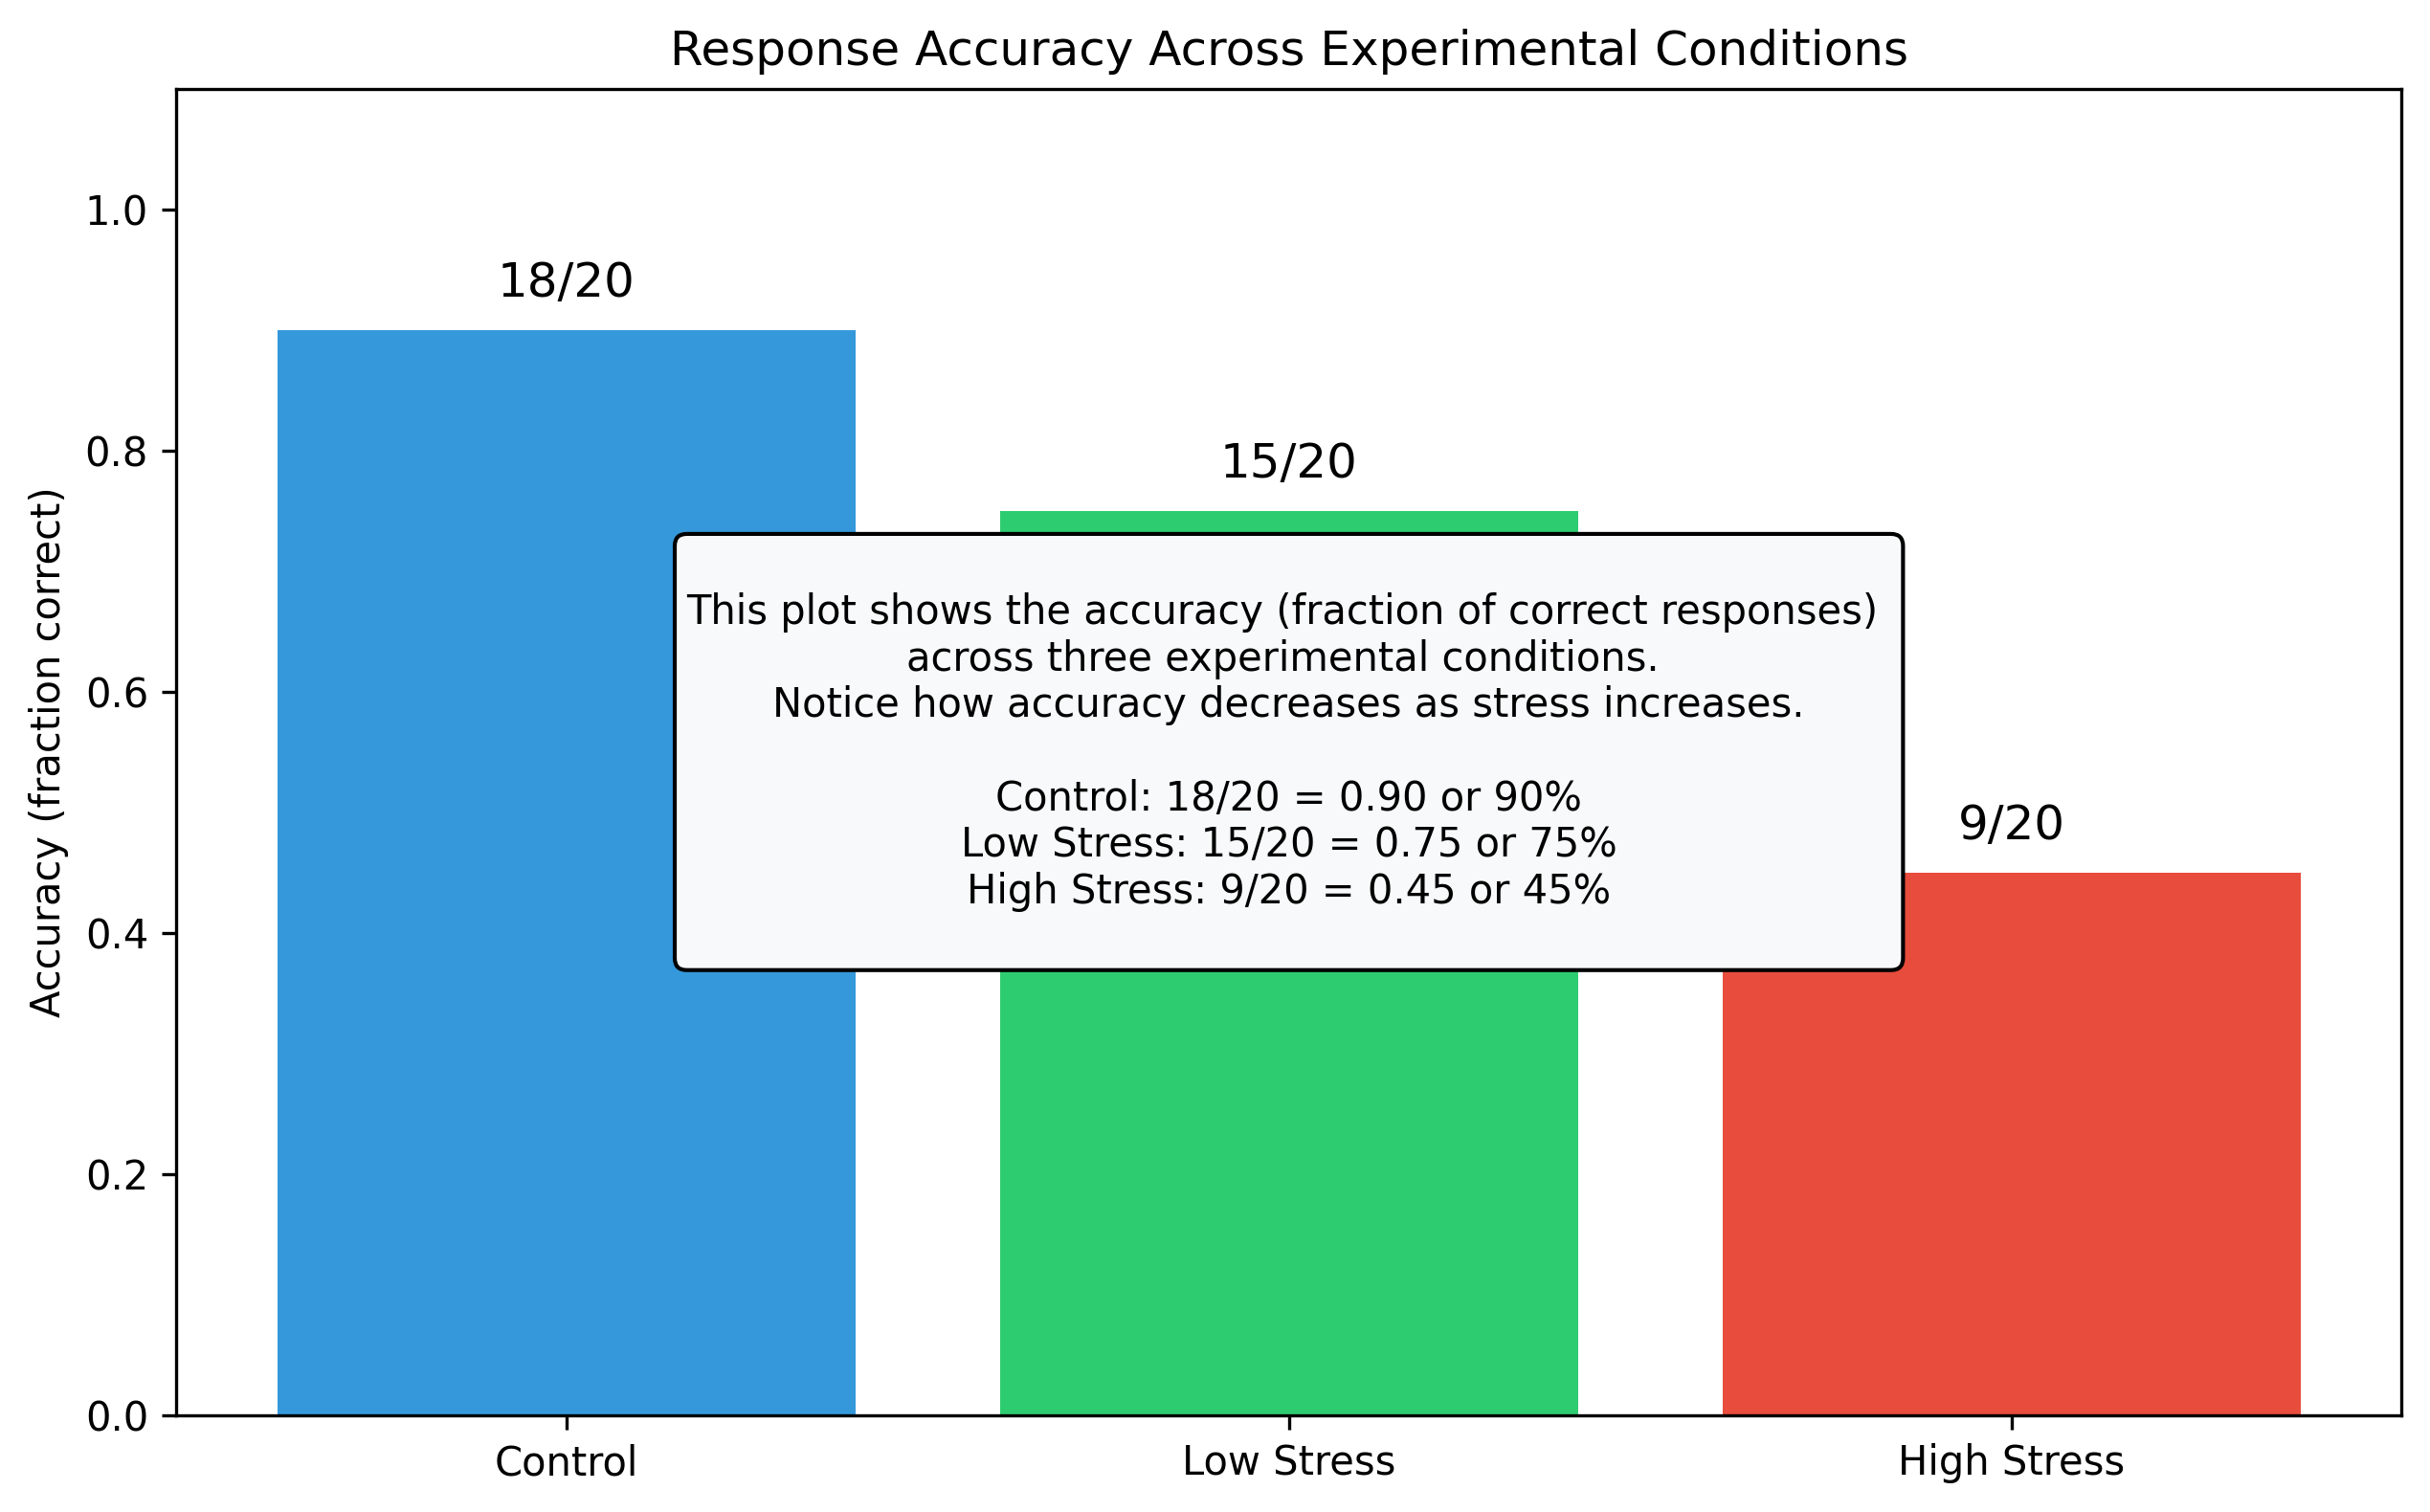
# Example: Analyzing response accuracy across different conditions in an experiment

# Number of correct responses and total trials in three experimental conditions
condition_names = ['Control', 'Low Stress', 'High Stress']
correct_responses = [18, 15, 9]  # Number of correct responses in each condition
total_trials = [20, 20, 20]      # Total number of trials in each condition

# Calculate accuracy as a fraction for each condition
accuracy_fractions = [f"{correct}/{total}" for correct, total in zip(correct_responses, total_trials)]

# Calculate accuracy as a decimal for plotting
accuracy_decimals = [correct/total for correct, total in zip(correct_responses, total_trials)]

# Plot the results
plt.figure(figsize=(10, 6))
bars = plt.bar(condition_names, accuracy_decimals, color=['#3498db', '#2ecc71', '#e74c3c'])

# Add labels above each bar showing the fraction
for i, (bar, fraction) in enumerate(zip(bars, accuracy_fractions)):
    height = bar.get_height()
    plt.text(bar.get_x() + bar.get_width()/2., height + 0.02,
            fraction, ha='center', va='bottom', fontsize=12)

# Format the plot
plt.ylim(0, 1.1)  # Set y-axis limit to accommodate the text labels
plt.ylabel('Accuracy (fraction correct)')
plt.title('Response Accuracy Across Experimental Conditions')

# Add a text box explaining the plot
explanation = """
This plot shows the accuracy (fraction of correct responses)
across three experimental conditions.
Notice how accuracy decreases as stress increases.

Control: 18/20 = 0.90 or 90%
Low Stress: 15/20 = 0.75 or 75%
High Stress: 9/20 = 0.45 or 45%
"""

plt.annotate(explanation, xy=(0.5, 0.5), xycoords='axes fraction',
             bbox=dict(boxstyle="round,pad=0.3", fc="#f8f9fa", ec="black", lw=1),
             ha='center', va='center', fontsize=10)

plt.show()
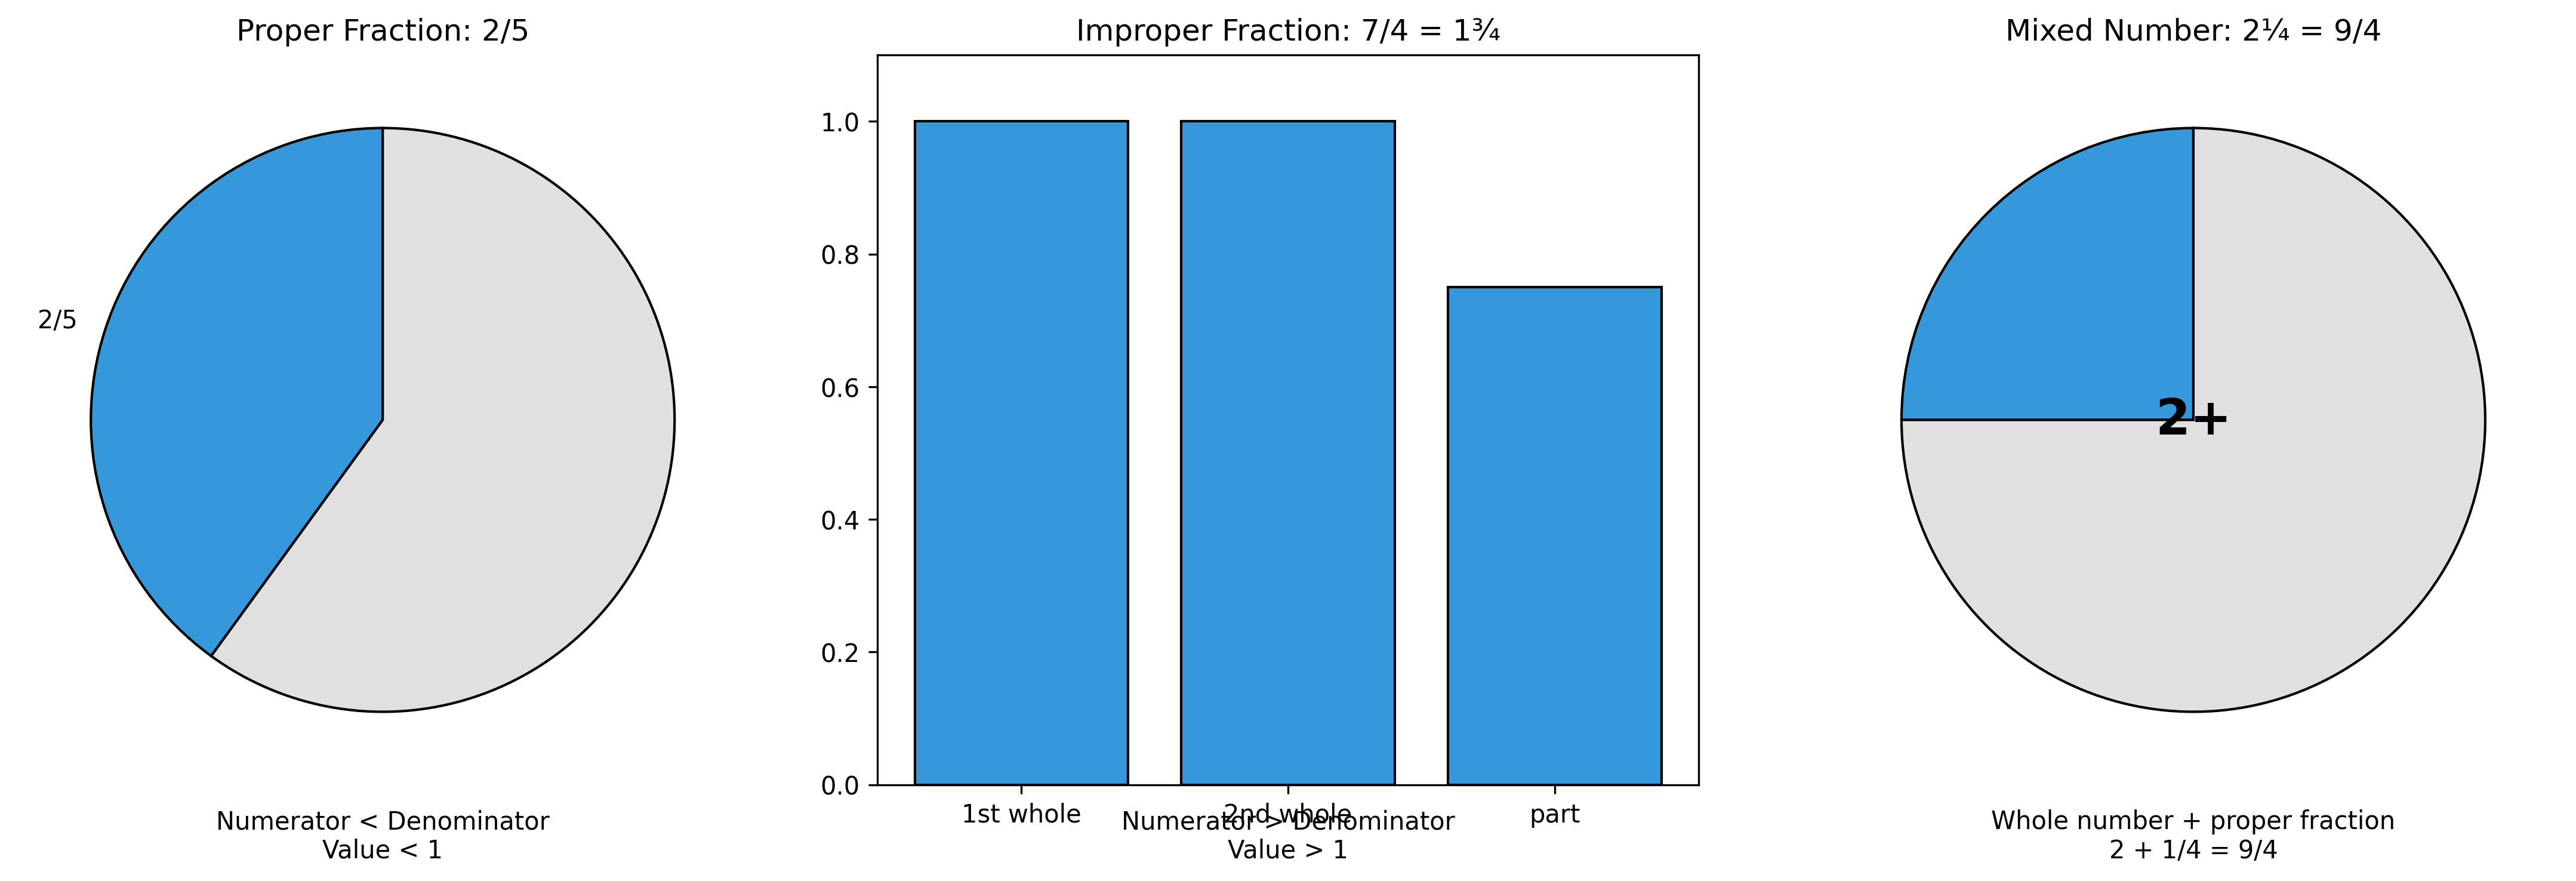
Types of Fractions#
There are several important types of fractions to understand:
Proper fractions: The numerator is less than the denominator (e.g., \(\frac{2}{3}\), \(\frac{5}{8}\)). These represent values less than 1.
Improper fractions: The numerator is greater than or equal to the denominator (e.g., \(\frac{5}{3}\), \(\frac{7}{4}\)). These represent values greater than or equal to 1.
Mixed numbers: A whole number and a proper fraction combined (e.g., \(2\frac{1}{4}\), which equals \(\frac{9}{4}\)). These are often used in everyday contexts.
Let’s visualize these different types:
# Function to visualize different types of fractions
def visualize_fraction_types():
    fig, axes = plt.subplots(1, 3, figsize=(15, 5))

    # Example 1: Proper fraction (2/5)
    ax = axes[0]
    data = [2, 3]  # 2 filled parts, 3 empty parts (total 5)
    labels = ['2/5', '']
    colors = ['#3498db', '#e0e0e0']
    ax.pie(data, labels=labels, colors=colors,
          startangle=90, wedgeprops={'edgecolor': 'black'})
    ax.set_title("Proper Fraction: 2/5", fontsize=12)
    ax.annotate("Numerator < Denominator\nValue < 1", xy=(0.5, -0.1),
               xycoords='axes fraction', ha='center', fontsize=10)

    # Example 2: Improper fraction (7/4)
    ax = axes[1]
    # Create a stacked bar chart to show the improper fraction
    # Each bar represents one whole unit
    units = [1, 1, 0.75]  # 1 + 1 + 0.75 = 2.75 (which is 7/4 = 1.75)
    unit_labels = ['1st whole', '2nd whole', 'part']
    ax.bar(unit_labels, units, color='#3498db', edgecolor='black')
    ax.set_ylim(0, 1.1)
    ax.set_title("Improper Fraction: 7/4 = 1¾", fontsize=12)
    ax.annotate("Numerator > Denominator\nValue > 1", xy=(0.5, -0.1),
               xycoords='axes fraction', ha='center', fontsize=10)

    # Example 3: Mixed number (2¼)
    ax = axes[2]
    data = [1, 3]  # 1 filled part, 3 empty parts (total 4) for the fraction part
    labels = ['', '']
    colors = ['#3498db', '#e0e0e0']
    ax.pie(data, labels=labels, colors=colors,
          startangle=90, wedgeprops={'edgecolor': 'black'})
    # Add text to show this is 2¼
    ax.text(0, 0, "2+", ha='center', va='center', fontsize=20, fontweight='bold')
    ax.set_title("Mixed Number: 2¼ = 9/4", fontsize=12)
    ax.annotate("Whole number + proper fraction\n2 + 1/4 = 9/4", xy=(0.5, -0.1),
               xycoords='axes fraction', ha='center', fontsize=10)

    plt.tight_layout()
    plt.show()

# Visualize different types of fractions
visualize_fraction_types()
Converting Between Fractions#
It’s often useful to convert between different representations of fractions:
Converting an improper fraction to a mixed number:
Divide the numerator by the denominator
The quotient is the whole number part
The remainder is the new numerator
The denominator stays the same
Example: \(\frac{11}{4} = 2\frac{3}{4}\) (because \(11 ÷ 4 = 2\) with remainder \(3\))
Converting a mixed number to an improper fraction:
Multiply the whole number by the denominator
Add the numerator
Keep the same denominator
Example: \(3\frac{2}{5} = \frac{(3 \times 5) + 2}{5} = \frac{17}{5}\)
Let’s implement these conversions in Python:
# Function to convert improper fraction to mixed number
def improper_to_mixed(numerator, denominator):
    # Calculate whole number part (quotient)
    whole_part = numerator // denominator

    # Calculate remaining fraction part (remainder)
    new_numerator = numerator % denominator

    # Return the result
    if new_numerator == 0:
        return f"{whole_part}"
    else:
        return f"{whole_part} + {new_numerator}/{denominator}"

# Function to convert mixed number to improper fraction
def mixed_to_improper(whole_part, numerator, denominator):
    # Calculate new numerator
    new_numerator = (whole_part * denominator) + numerator

    # Return the result
    return f"{new_numerator}/{denominator}"

# Examples
print("Examples of converting improper fractions to mixed numbers:")
examples_improper = [(11, 4), (7, 3), (15, 4), (8, 5)]
for num, den in examples_improper:
    result = improper_to_mixed(num, den)
    print(f"{num}/{den} = {result}")

print("\nExamples of converting mixed numbers to improper fractions:")
examples_mixed = [(2, 3, 5), (1, 1, 2), (3, 2, 3), (4, 3, 4)]
for whole, num, den in examples_mixed:
    result = mixed_to_improper(whole, num, den)
    print(f"{whole} + {num}/{den} = {result}")
Examples of converting improper fractions to mixed numbers:
11/4 = 2 + 3/4
7/3 = 2 + 1/3
15/4 = 3 + 3/4
8/5 = 1 + 3/5

Examples of converting mixed numbers to improper fractions:
2 + 3/5 = 13/5
1 + 1/2 = 3/2
3 + 2/3 = 11/3
4 + 3/4 = 19/4
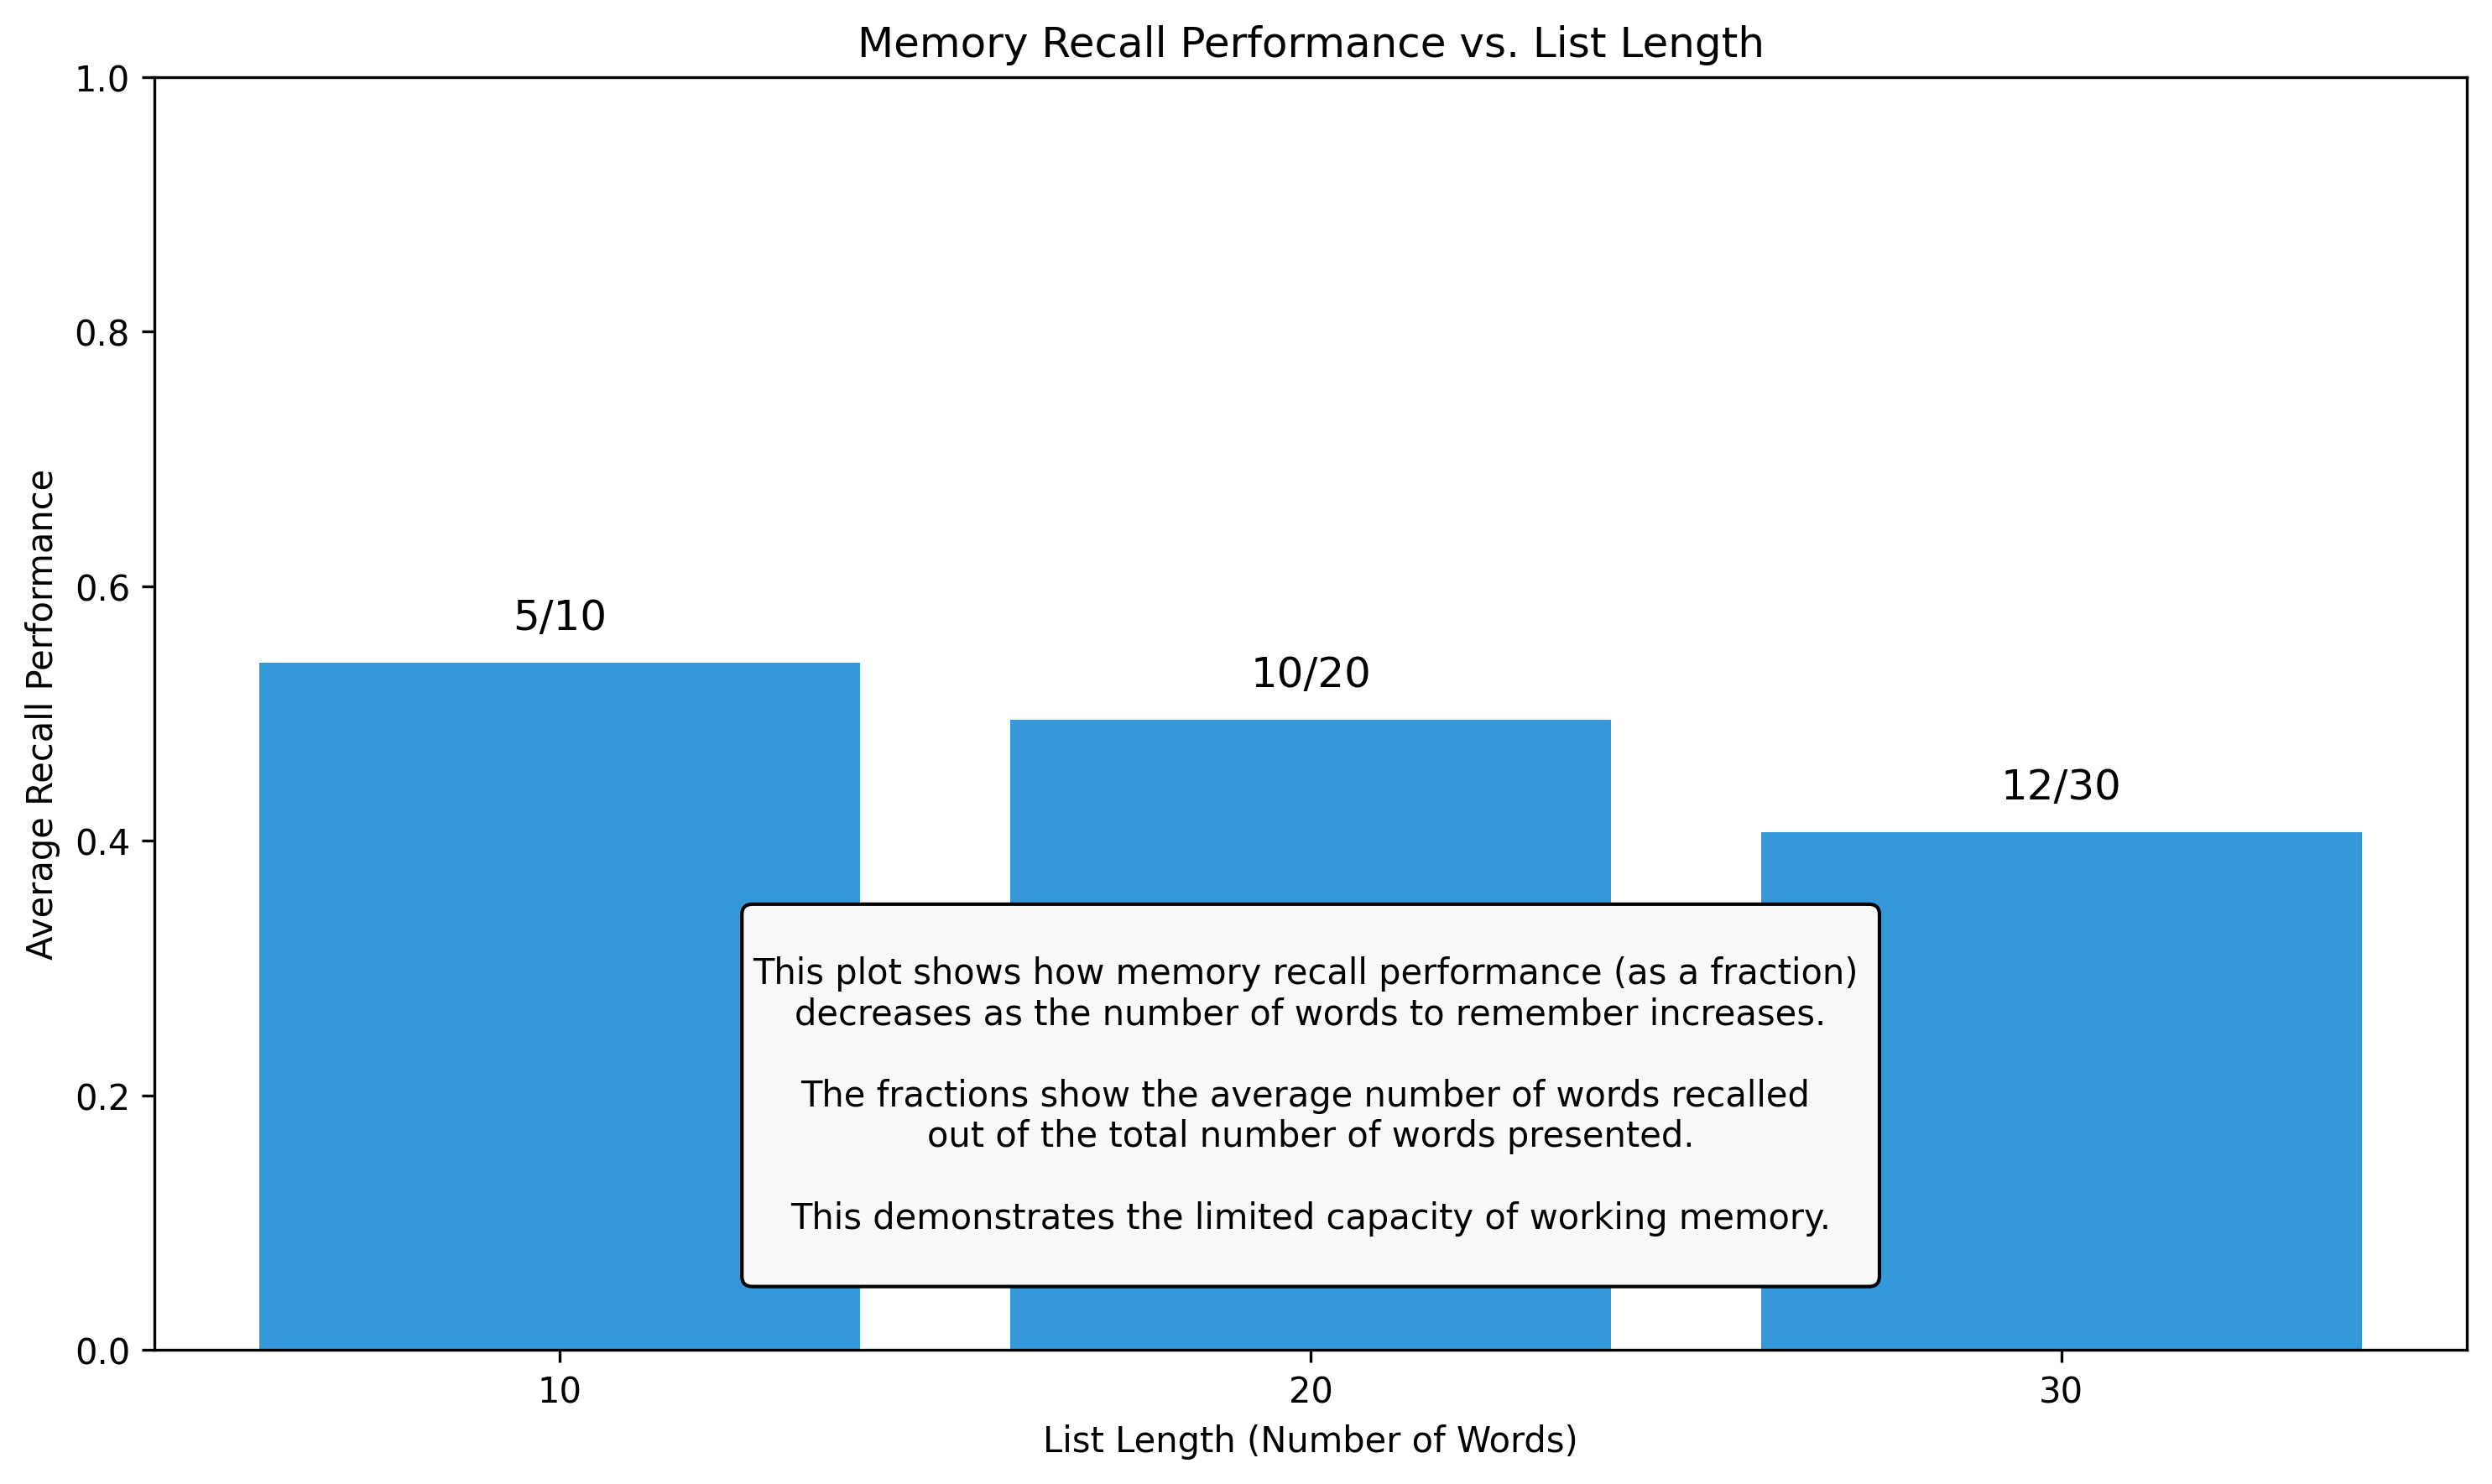
Applications in Psychological Research#
Let’s look at how fractions are used in a typical psychology experiment. Imagine a memory recall study where participants are asked to remember words from a list.
# Memory recall example
import numpy as np
import pandas as pd

# Simulate data for 10 participants
# Each participant tries to recall words from three different list lengths
np.random.seed(42)  # For reproducibility

# Number of participants
n_participants = 10

# List lengths used in the experiment
list_lengths = [10, 20, 30]

# Create a function to simulate recall performance
def simulate_recall(list_length, recall_probability=0.7):
    # Add some variability to recall probability based on list length
    adjusted_probability = recall_probability - (list_length / 100)
    # Simulate recall for each word (1 = recalled, 0 = forgotten)
    recall_results = np.random.binomial(1, adjusted_probability, list_length)
    # Return number of words recalled
    return recall_results.sum()

# Create a dataframe to store results
data = []
for participant_id in range(1, n_participants + 1):
    for list_length in list_lengths:
        # Simulate recall performance
        words_recalled = simulate_recall(list_length)

        # Calculate recall as a fraction
        recall_fraction = f"{words_recalled}/{list_length}"

        # Calculate recall as a decimal
        recall_decimal = words_recalled / list_length

        # Add to data
        data.append({
            'Participant': participant_id,
            'List Length': list_length,
            'Words Recalled': words_recalled,
            'Recall Fraction': recall_fraction,
            'Recall Decimal': recall_decimal
        })

# Create dataframe
df = pd.DataFrame(data)

# Display the first few rows
print("Sample of experimental results:")
print(df.head())

# Calculate average recall performance for each list length
average_recall = df.groupby('List Length')['Recall Decimal'].mean()

# Plot the results
plt.figure(figsize=(10, 6))
bars = plt.bar(average_recall.index.astype(str), average_recall.values, color='#3498db')

# Add text labels showing the average recall fractions
for i, list_length in enumerate(list_lengths):
    avg_words = int(round(average_recall[list_length] * list_length))
    avg_fraction = f"{avg_words}/{list_length}"
    plt.text(i, average_recall[list_length] + 0.02, avg_fraction,
             ha='center', va='bottom', fontsize=12)

# Format the plot
plt.ylim(0, 1.0)
plt.xlabel('List Length (Number of Words)')
plt.ylabel('Average Recall Performance')
plt.title('Memory Recall Performance vs. List Length')

# Add a text box explaining the plot
explanation = """
This plot shows how memory recall performance (as a fraction)
decreases as the number of words to remember increases.

The fractions show the average number of words recalled
out of the total number of words presented.

This demonstrates the limited capacity of working memory.
"""

plt.annotate(explanation, xy=(0.5, 0.2), xycoords='axes fraction',
             bbox=dict(boxstyle="round,pad=0.3", fc="#f8f9fa", ec="black", lw=1),
             ha='center', va='center', fontsize=10)

plt.tight_layout()
plt.show()
Sample of experimental results:
   Participant  List Length  Words Recalled Recall Fraction  Recall Decimal
0            1           10               5            5/10            0.50
1            1           20               7            7/20            0.35
2            1           30              12           12/30            0.40
3            2           10               7            7/10            0.70
4            2           20              10           10/20            0.50
Summary#
In this chapter, we’ve introduced the concept of fractions and their importance in mathematics and psychology. We’ve covered:
What fractions are: parts of a whole, represented by a numerator and denominator
Different types of fractions: proper fractions, improper fractions, and mixed numbers
Converting between representations: how to convert between improper fractions and mixed numbers
Applications in psychology: how fractions are used to represent data in psychological research
In the next chapter, we’ll explore how to perform operations with fractions, such as addition, subtraction, multiplication, and division.
Practice Exercises#
Identify the type of fraction: For each fraction, determine whether it’s a proper fraction, improper fraction, or mixed number:
\(\frac{3}{8}\)
\(\frac{7}{4}\)
\(2\frac{1}{3}\)
\(\frac{9}{9}\)
\(5\frac{2}{7}\)
Convert between representations:
Convert \(\frac{11}{3}\) to a mixed number
Convert \(4\frac{2}{5}\) to an improper fraction
Convert \(\frac{25}{6}\) to a mixed number
Convert \(1\frac{3}{4}\) to an improper fraction
Psychology application: In a study, researchers presented 25 words to participants and asked them to recall as many as possible. If a participant recalled 15 words, what fraction of the words did they recall? Express your answer as both a fraction and a decimal.
Visualization: Use the provided visualization functions to create a pie chart representation of the fraction \(\frac{5}{8}\).
Real-world application: A clinical psychologist reports that \(\frac{3}{4}\) of their clients showed improvement after 8 therapy sessions. If the psychologist has 28 clients total, how many clients showed improvement?